How are stock purchase disclosures by politicians related to stock prices?

To explore the relationship between U.S. politicians’ stock purchase disclosures and stock returns, I reviewed the article titled “Perceptions of Political Self-Dealing? An Empirical Investigation of Market Returns Surrounding the Disclosure of Politician Stock Purchases,” published in the Strategic Management Journal in October 2022.
Hypotheses and Methodology
Hypothesis 1: The disclosure of stock purchases by senators will trigger a positive market reaction for the respective company’s stock.
Hypothesis 2: If a senator serves on a committee that oversees a specific company, the market reaction will be stronger.
Hypothesis 3a, 3b, 3c: When the company has lobbied on the senator’s legislation, testified in a committee where the senator serves, or has connections with the senator through campaign contributions, the market reaction to the senator’s stock purchase disclosure will be amplified.
Methodology
-
Event Study and Cumulative Abnormal Return (CAR) Calculation: To measure the abnormal returns before and after the disclosure of senators’ stock purchases, they used the Fama-French 4-factor model to calculate CAR. They analyzed stock price changes across various event windows (e.g., disclosure day and the following day (0, +1), etc.).
-
Cross-Sectional Regression Analysis: To examine the impact of variables such as committee membership, lobbying activities, and campaign contributions on market reactions, they conducted an OLS regression analysis.
-
Information Asymmetry Check: To ensure that no information was leaked prior to the disclosure, they reviewed media coverage and conducted an additional event study for the actual purchase date.
Between 2012 and 2020, 2,234 instances of senators’ stock purchases were used as the sample for Hypothesis 1, and 2,066 instances were used as the sample for the other four hypotheses.
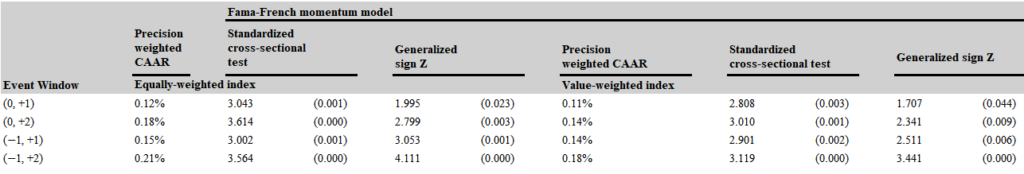
The above table shows the cumulative average abnormal returns (CAAR) analysis results for the impact of senators’ stock purchase disclosures on stock prices.
Both the equally-weighted index (where equal weights are given to each event) and the value-weighted index (considering each stock’s market capitalization) recorded positive CAAR across all four event windows. The standardized cross-sectional test and the generalized sign Z values also show statistically significant p-values, supporting Hypothesis 1 that the market reacts positively for a certain period after a senator’s purchase disclosure.
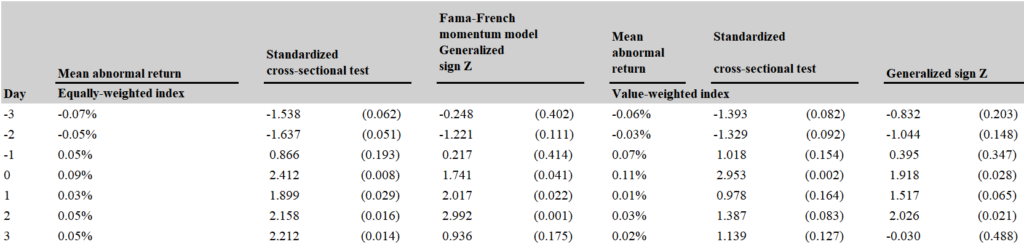
Table 2 reveals daily abnormal returns, capturing the stock price reaction before and after the senator’s stock purchase disclosures.
On the disclosure day, the equally-weighted and value-weighted abnormal returns were 0.09% and 0.11%, respectively, both statistically significant. Conversely, before the disclosure, abnormal returns were either negative (D-3, D-2) or positive but not statistically significant (D-1, p>0.1). Thus, Table 2 provides evidence for Hypothesis 1, showing a positive market reaction on the disclosure day and the days following it.
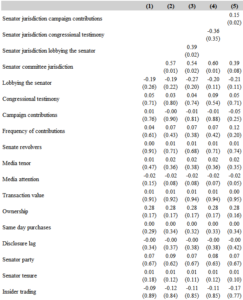
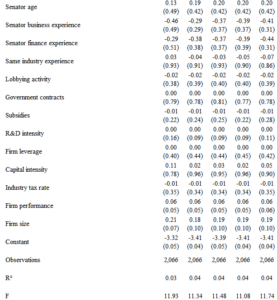
Finally, Table 3 uses cross-sectional analysis to examine the factors influencing abnormal returns following senators’ stock purchase disclosures.
This analysis uses Ordinary Least Squares (OLS) regression to understand how various factors affect stock prices when senators’ stock purchases are disclosed. Each coefficient in the table indicates the effect of independent variables on CAAR.
-
Senator jurisdiction * lobbying the senator: When senators have lobbied for legislation benefiting a specific company, it has a significant positive impact on abnormal returns (coefficient 0.39, p = 0.02), supporting Hypothesis 3a.
-
Senator committee jurisdiction: When a senator serves on a committee overseeing the company’s industry, abnormal returns increase significantly (coefficient 0.57, p = 0.01), supporting Hypothesis 2.
-
Senator jurisdiction * campaign contributions: When companies make campaign contributions to senators, abnormal returns increase (coefficient 0.15, p = 0.02), indicating that campaign contributions may signal a positive relationship between the senator and the company, supporting Hypothesis 3c.
-
Senator jurisdiction * congressional testimony: The coefficient for this variable is -0.36, but the p-value is 0.35, which is not statistically significant. Therefore, Hypothesis 3b is rejected.
Summary
In summary, this study identifies short-term profit opportunities following senators’ stock purchase disclosures. Additionally, analyzing the historical or current relationships between senators and companies, such as committee memberships or lobbying connections, may also reveal opportunities for abnormal returns.
Explore opportunities for generating abnormal returns by leveraging Waiker’s politician trading data.